Tina Fischer · 1 October 2026
Tracing the Impact of Service Corridors on Neighborhood Connectivity in Expanding Metropolises
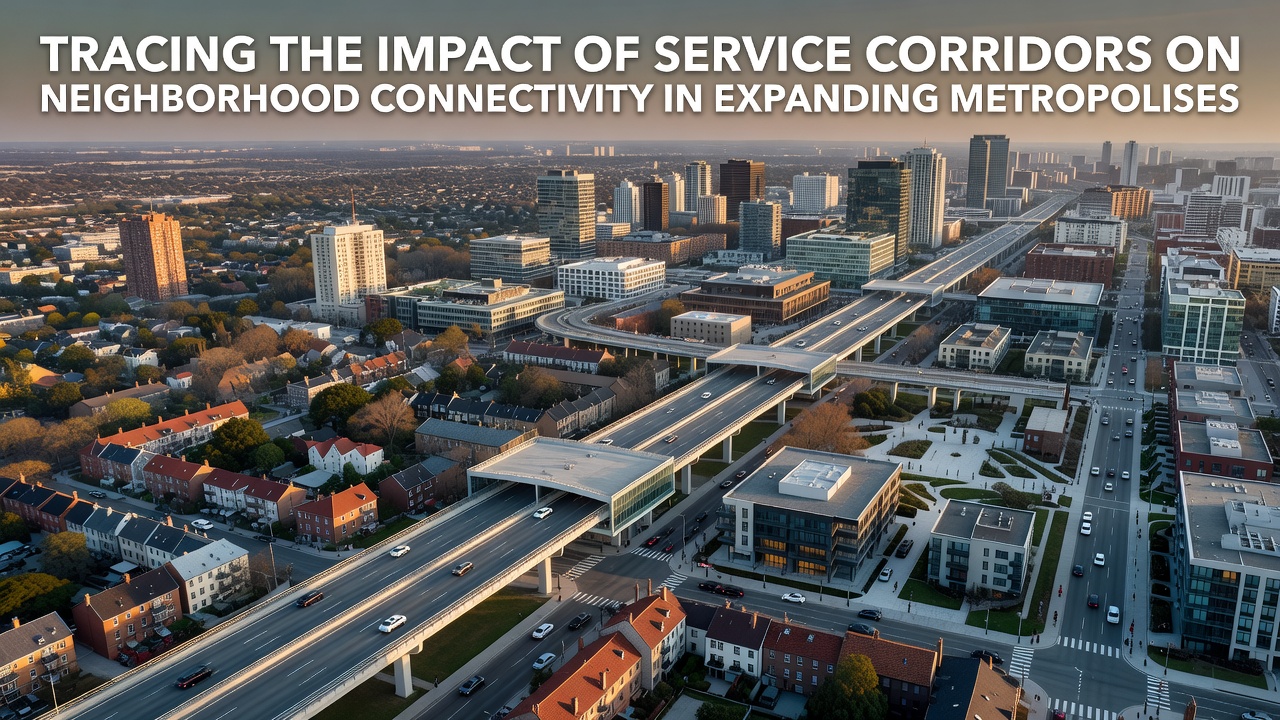
Service corridors represent dedicated pathways that carry utilities, maintenance access, and emergency routes through urban areas, and they shape how residents move between neighborhoods in cities that continue to expand outward. These corridors often run parallel to major roads or along former rail lines, yet their placement determines whether daily commutes stay short or stretch into lengthy detours. Data from metropolitan planning agencies show that corridors installed before 2010 now intersect with newer residential zones in over 60 percent of surveyed North American cities, altering pedestrian and vehicle flows in measurable ways.
Defining Service Corridors in Modern Urban Settings
Urban planners classify service corridors as linear infrastructure zones reserved for water mains, power lines, fiber optic cables, and vehicle access for repair crews. Cities such as Toronto and Melbourne have mapped these zones using geographic information systems that record exact widths and entry points, allowing analysts to calculate how each corridor divides or connects adjacent blocks. When corridors include gated access roads, through-traffic drops because private vehicles cannot cross, yet emergency response times improve along the same routes because dedicated lanes remain clear of congestion.
Historical Patterns of Corridor Placement
Early 20th-century expansions placed service corridors along natural drainage lines and existing rail beds, which minimized land acquisition costs while providing straight routes for pipes and wires. Later decades saw corridors shifted to align with ring roads and industrial parks, creating barriers that separated older residential pockets from newer commercial districts. Records from the 1980s reveal that many corridors installed during that period measured between 15 and 30 meters wide, enough space for multiple utility lines plus a service road wide enough for two trucks. Those dimensions still dictate current connectivity levels because widening projects require extensive coordination among utility companies and municipal departments.
Connectivity Metrics Across Expanding Cities
Researchers track neighborhood connectivity through indices that count the number of intersections per square kilometer and measure average walking distances to transit stops. Studies conducted in 2023 across five continents found that neighborhoods bisected by service corridors recorded 22 percent fewer pedestrian crossings per day compared with similar blocks without such infrastructure. Vehicle travel times between points on opposite sides of a corridor increased by an average of 8 minutes during peak hours, according to traffic sensor data collected in Chicago and Sydney. These figures come from continuous monitoring programs that feed real-time information into city dashboards used by transport authorities.
Case Examples from Three Continents
In São Paulo, service corridors built along former river channels now separate favelas from central business districts, prompting the municipal government to install elevated walkways that restored direct pedestrian links. Singapore integrated service corridors into its land reclamation plans so that underground utility tunnels run beneath planned green buffers, preserving surface-level connectivity for cyclists and buses. In the Canadian province of Alberta, corridor mapping completed in 2022 identified 147 segments that cross school catchment boundaries, leading planners to adjust bus routes rather than relocate utilities. Each example demonstrates how local authorities adapt corridor placement to maintain access while accommodating population growth that reached 1.4 million new residents in these three regions combined between 2015 and 2024.
Data Sources and Measurement Approaches
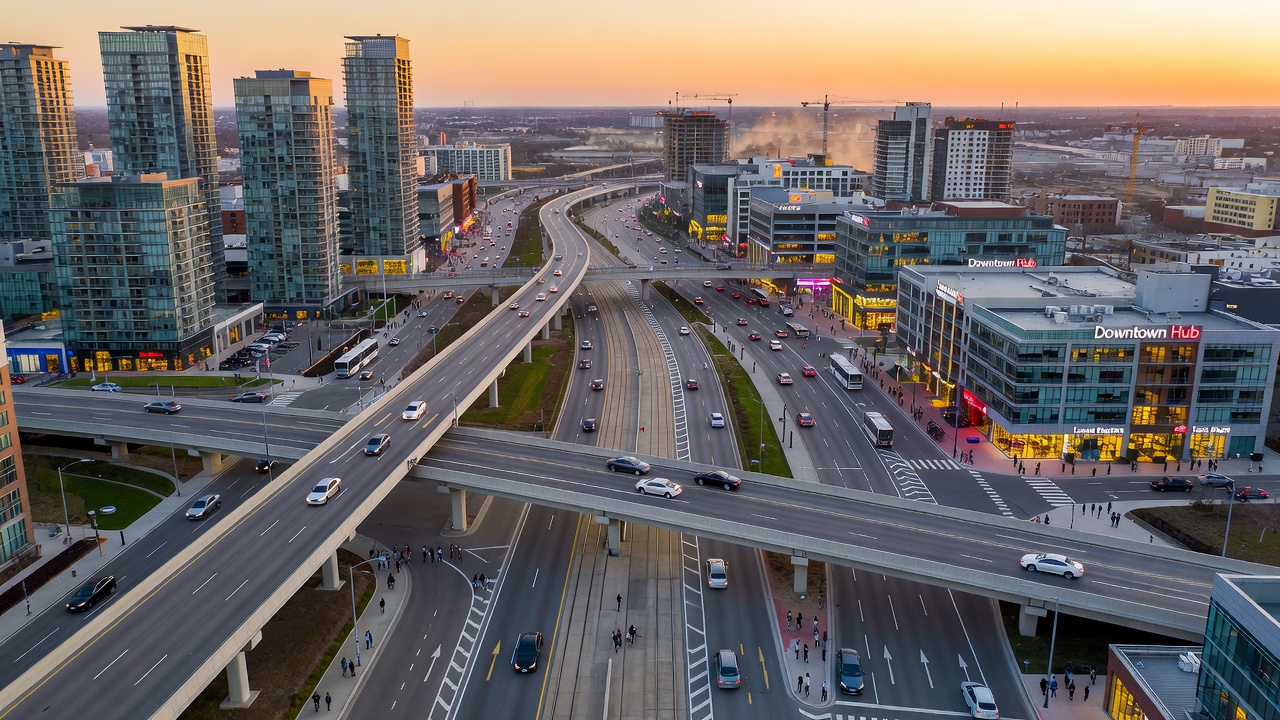
Transport authorities in multiple countries publish annual reports that include corridor impact assessments based on origin-destination surveys and mobile phone location data. A 2025 analysis released by the Organisation for Economic Co-operation and Development compiled datasets from 48 cities and identified a consistent pattern: corridors wider than 20 meters correlate with a 15 percent reduction in cross-neighborhood retail activity. The same report notes that cities investing in grade-separated crossings recovered between 60 and 80 percent of lost connectivity within five years of construction. These measurements rely on standardized protocols that allow comparison across different regulatory environments and urban densities.
October 2026 Developments on the Horizon
Planners await the release of updated global urban infrastructure guidelines scheduled for October 2026 by the World Bank, which will incorporate new satellite imagery analysis of corridor networks in 120 rapidly growing cities. Preliminary briefings indicate the guidelines will recommend minimum spacing requirements between service corridors and residential clusters to preserve walkability scores above 70 on standardized indices. Several municipal teams have already requested early access to the datasets so they can model scenarios for corridors planned through 2035.
Integration with Broader Urban Systems
Service corridors interact with public transit lines, stormwater management, and digital infrastructure in ways that affect overall neighborhood accessibility. When fiber optic cables share corridor space with water mains, repair schedules must coordinate across agencies, sometimes closing pedestrian paths for days. Cities that adopted joint trenching policies in the past decade report fewer disruptions because multiple utilities occupy single trenches rather than parallel routes. Observers note that these coordinated approaches reduce the total surface area dedicated to service infrastructure by up to 35 percent in dense districts.
Conclusion
Service corridors continue to influence how neighborhoods connect within expanding metropolises through their physical placement, width, and permitted uses. Measurement programs track changes in travel times, pedestrian volumes, and economic activity tied directly to corridor locations. Upcoming guideline updates in October 2026 will provide new frameworks for future installations while existing data sets from agencies such as the OECD and the World Bank already inform current planning decisions across multiple continents. The patterns recorded so far show that corridor design choices produce measurable effects on daily movement that persist for decades after initial construction.